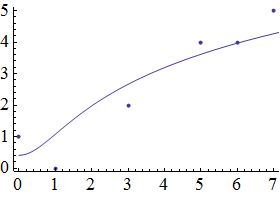
I am trying to understand how Mma computes the Confidence Intervals after a NonlinearModelFit. Consider the following example:
data = {{0, 1}, {1, 0}, {3, 2}, {5, 4}, {6, 4}, {7, 5}};
nlm = NonlinearModelFit[data, Log[a + b x^2], {a, b}, x];
Show[ListPlot[data, Joined -> False], Plot[Normal@nlm, {x, 0, 8}],ImageSize -> 200]
(*out*)

Which comes with the following R squared and confidence intervals:
nlm["RSquared"]
nlm["ParameterConfidenceIntervalTable"]

(*Out*)0.957573
(*Out*)

The table above assumes the default 95% Confidence Interval and, I am assuming, normal distribution around a=1.50632 and b=1.42633.
Questions:
- How does Mma estimate the Standard Error of
aandb? - The mean used to estimate such confidence intervals is the sample mean, i.e. ~2.6667?
I could not find in the documentation how this was done from a fitting. Thank you in advance.
