31
$\begingroup$

Bug fixed in 13.0.0


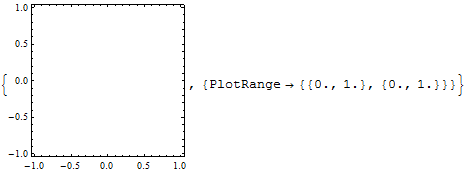
The problem in general involves the unreliable behaviour of AbsoluteOptions when option values are implicitly specified (e.g. Automatic, All, Full, etc.), for example the graphics below clearly has a different plot range than the one reported by AbsoluteOptions:

{g = Graphics[{}, Frame -> True], AbsoluteOptions[g, PlotRange]}

enter image description here


Original example

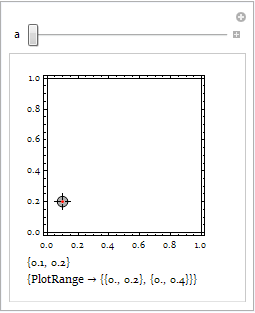
For demonstrating the problem, have a look at the following example, and try adjusting the rotation angle a and/or the Locator position, comparing the real PlotRange of pic indicated by the frame-ticks with the one under the graph obtained by AbsoluteOptions[pic, PlotRange]:

Manipulate[
 DynamicModule[{pic},
  Column[{
    pic = Graphics[{FaceForm[], EdgeForm[Black],
       GeometricTransformation[Rectangle[], RotationTransform[a]],
       Red, Point[p]},
      Frame -> True],
    p,
    AbsoluteOptions[pic, PlotRange]
    }]
  ],
 {{a, 0}, 0, 2 Pi},
 {{p, {.1, .2}}, {-2, -2}, {2, 2}, Locator}]

Mathematica graphics

As shown in the screen capture above, in my Mathematica 9.0 on Windows 7 64-bit system, the PlotRange from AbsoluteOptions is not consistent with the real range. And the angle a seems to do nothing with it.

Additional tests in my system suggest this problem is not restricted to the presence of RotationTransform, but comes with the GeometricTransformation. And it happens not only on Graphics but also on Graphics3D.

So my questions are:

  • What is going on here?

  • How can I obtain the real PlotRange of the Graphics/Graphics3D when there are GeometricTransformations in it?

$\endgroup$
16
  • 3
    $\begingroup$ I wish there was a collection with all the unexpected behaiviours of AbsoluteOptions $\endgroup$
    – ssch
    Commented Jan 18, 2013 at 21:01
  • 2
    $\begingroup$ @ssch Hmm.. I'm not sure this is a behavior of AbsoluteOptions or GeometricTransformation. After all the latter one has records too. $\endgroup$
    – Silvia
    Commented Jan 18, 2013 at 21:04
  • 2
    $\begingroup$ @Silvia Do you think that GeometricTransformation is relevant here? In my understanding, the problem boils down to this simple example which returns wrong values: g = Graphics[{}, Frame -> True]; Print[g]; AbsoluteOptions[g, PlotRange]. I hope you don't mind that I added this to your Q to make it more general, if so, please feel free to revert. $\endgroup$ Commented Sep 10, 2013 at 9:09
  • 1
    $\begingroup$ Strongly related: mathematica.stackexchange.com/a/138907/280 $\endgroup$ Commented Mar 1, 2017 at 16:50
  • 2
    $\begingroup$ @AlexeyPopkov Thank you for the prompt edit. I feel very thankful this is fixed! :D $\endgroup$
    – Silvia
    Commented Dec 15, 2021 at 19:56

5 Answers 5

25
$\begingroup$

UPDATE

In version 13.0.0 the described long-standing bug in determining PlotRange via AbsoluteOptions is fixed.


Original answer

AbsoluteOptions is known as very buggy function and the bug in determining the true PlotRange has very long history...

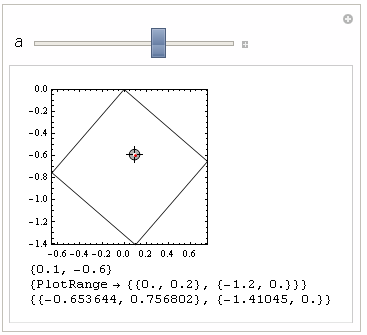
You could try my Ticks-based workaround for getting the complete PlotRange (with PlotRangePadding added):

completePlotRange[plot:(_Graphics|_Graphics3D|_Graph)] := 
  Last@
   Last@Reap[
     Rasterize[
      Show[plot, Axes -> True, Frame -> False, Ticks -> ((Sow[{##}]; Automatic) &), 
       DisplayFunction -> Identity, ImageSize -> 0], ImageResolution -> 1]]

Manipulate[
 DynamicModule[{pic}, 
  Column[{pic = 
     Graphics[{FaceForm[], EdgeForm[Black], 
       GeometricTransformation[Rectangle[], RotationTransform[a]], 
       Red, Point[p]}, Frame -> True, PlotRangePadding -> 0], p, 
    AbsoluteOptions[pic, PlotRange], completePlotRange[pic]}]], {{a, 
   4}, 0, 2 Pi}, {{p, {.1, -.6}}, {-2, -2}, {2, 2}, Locator}, 
 ContinuousAction -> False, SynchronousUpdating -> False]
screenshot

EDIT

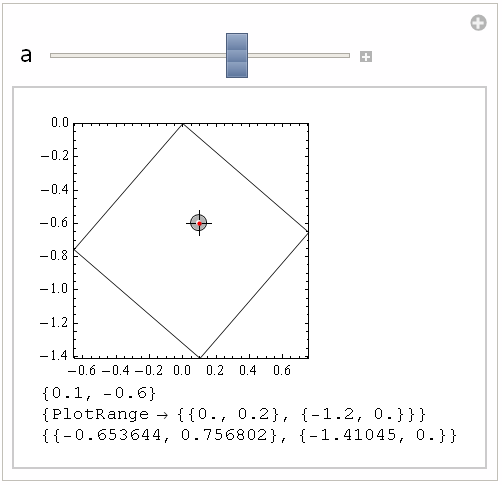
One can get the exact PlotRange (without the PlotRangePadding added) with the following function:

plotRange[plot : (_Graphics | _Graphics3D | _Graph)] := 
  Last@
   Last@Reap[
     Rasterize[
      Show[plot, PlotRangePadding -> None, Axes -> True, Frame -> False, 
       Ticks -> ((Sow[{##}]; Automatic) &), DisplayFunction -> Identity, ImageSize -> 0], 
      ImageResolution -> 1]]

Manipulate[
 DynamicModule[{pic}, 
  Column[{pic = 
     Graphics[{FaceForm[], EdgeForm[Black], 
       GeometricTransformation[Rectangle[], RotationTransform[a]], 
       Red, Point[p]}, Frame -> True], p, 
    AbsoluteOptions[pic, PlotRange], plotRange[pic]}]], {{a, 4}, 0, 
  2 Pi}, {{p, {.1, -.6}}, {-2, -2}, {2, 2}, Locator}, 
 SynchronousUpdating -> False]
screenshot

EDIT 2

Here is timing comparison of various ways to get real PlotRange:

completePlotRange[plot : (_Graphics | _Graphics3D | _Graph)] := 
  Last@
   Last@Reap[
     Rasterize[
      Show[plot, Axes -> True, Frame -> False, Ticks -> ((Sow[{##}]; Automatic) &), 
       DisplayFunction -> Identity, ImageSize -> 0], ImageResolution -> 1]]
completePlotRange[plot : (_Graphics | _Graphics3D | _Graph), format_] := 
  Last@
   Last@Reap[
     ExportString[
      Show[plot, Axes -> True, Frame -> False, Ticks -> ((Sow[{##}]; Automatic) &), 
       DisplayFunction -> Identity, ImageSize -> 0], format]]

pic = Graphics[{FaceForm[], EdgeForm[Black], 
    GeometricTransformation[Rectangle[], RotationTransform[.3]]}, 
   Frame -> True];
Print[{#, 
     AbsoluteTiming[
      First@Table[
        completePlotRange[pic, #], {100}]]}] & /@ {"RawBitmap", "BMP",
    "WMF", "EMF", "SVG", "PDF", "EPS"};

{RawBitmap,{2.8931655,{{-0.32158,0.981396},{-0.0250171,1.27587}}}}

{BMP,{3.0201728,{{-0.32158,0.981396},{-0.0250171,1.27587}}}}

{WMF,{4.3242473,{{-0.32158,0.981396},{-0.0250171,1.27587}}}}

{EMF,{4.0182298,{{-0.32158,0.981396},{-0.0250171,1.27587}}}}

{SVG,{3.1461800,{{-0.32158,0.981396},{-0.0250171,1.27587}}}}

{PDF,{16.9799712,{{-0.32158,0.981396},{-0.0250171,1.27587}}}}

{EPS,{7.3074179,{{-0.32158,0.981396},{-0.0250171,1.27587}}}}

AbsoluteTiming[First@Table[completePlotRange[pic], {100}]]

{2.3991372, {{-0.32158, 0.981396}, {-0.0250171, 1.27587}}}

One can see that Rasterize with ImageSize -> 0 is the fastest.

UPDATE 3

Here is purely Dynamic implementation of the same idea:

plotRange[plot : (_Graphics | _Graphics3D | _Graph)] := 
 Reap[NotebookDelete[
    First@{PrintTemporary[
       Show[plot, Axes -> True, Frame -> False, 
        Ticks -> ((Sow[{##}]; Automatic) &), 
        DisplayFunction -> Identity, PlotRangePadding -> None, 
        ImageSize -> 0]], FinishDynamic[]}]][[2, 1]]

completePlotRange[plot : (_Graphics | _Graphics3D | _Graph)] := 
 Reap[NotebookDelete[
    First@{PrintTemporary[
       Show[plot, Axes -> True, Frame -> False, 
        Ticks -> ((Sow[{##}]; Automatic) &), 
        DisplayFunction -> Identity, ImageSize -> 0]], 
      FinishDynamic[]}]][[2, 1]]
$\endgroup$
12
  • $\begingroup$ Awesome, thanks! This bug has been annoying me many times, good to finally have a proper workaround. $\endgroup$
    – ssch
    Commented Jan 19, 2013 at 0:16
  • $\begingroup$ Very nice idea +1 $\endgroup$
    – Rojo
    Commented Jan 19, 2013 at 0:34
  • $\begingroup$ Would you expect it to work on ContourPlot[Sin[x y], {x, 0, 7}, {y, 0, 2}] // completePlotRange? $\endgroup$
    – chris
    Commented Jan 19, 2013 at 1:03
  • 1
    $\begingroup$ @Alexey I've extended your marvellous code with Graph functionality. I also realized that if you have Frame -> True (at least for graphs) it is necessary that the frame is turned off inside the function, so added that too. $\endgroup$ Commented Sep 10, 2013 at 9:41
  • 1
    $\begingroup$ @Alexey Nice, clever idea to use PrintTemporary! This is fast enough for my purpose. $\endgroup$ Commented Sep 10, 2013 at 12:01
14
$\begingroup$

Here's another way using hidden functions that returns the plot range + padding...

Charting`get3DPlotRange @ Graphics3D[{}]
(*
   {{-1.04167, 1.04167}, {-1.04167, 1.04167}, {-1.04167, 1.04167}}
*)


Charting`get2DPlotRange @ Plot[Sin[x], {x, 0, 6}]
(*
   {{-0.12, 6.12}, {-1.04, 1.04}}
*)

The second argument of Charting`get2DPlotRange specifies whether padding should be calculated or not. Here, padding is ignored:

Charting`get2DPlotRange[Plot[Sin[x], {x, 0, 6}], False]
(*
   {{0, 6}, {-1., 1.}}
*)

...except that Charting`get2DPlotRange doesn't work on simple Graphics[{}] -- either of the OP's examples.

Charting`get2DPlotRange@Graphics[{}]
(*
   {{-0.02, 1.02}, {-0.02, 1.02}}
*)

Charting`get2DPlotRange@
 Graphics[{FaceForm[], EdgeForm[Black], 
   GeometricTransformation[Rectangle[], RotationTransform[Pi/4]], Red,
    Point[{2, 2}]}, Frame -> True]
(*
   {{-0.02, 1.02}, {-0.02, 1.02}}
*)

But Charting`get3DPlotRange seems more reliable (so far):

SeedRandom[1];
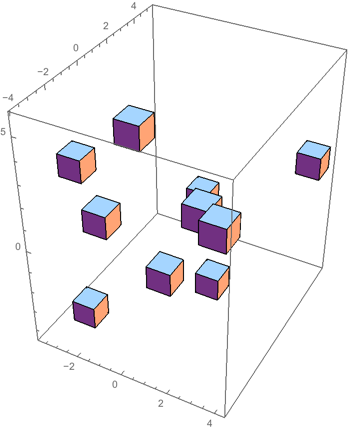
g = Graphics3D[{Translate[Cuboid[], RandomReal[{-5, 5}, {10, 3}]]}, Axes -> True]
Charting`get3DPlotRange[g]

Mathematica graphics

(*
   {{-3.8777, 4.41753}, {-4.07619, 5.44314}, {-4.55333, 5.98243}}
*)
$\endgroup$
3
  • $\begingroup$ This is Great! With Alexey's method now we have full solution for any graphics! $\endgroup$
    – Silvia
    Commented Jan 11, 2014 at 20:26
  • 4
    $\begingroup$ @MichaelE2 (+1) Note that Charting`get2DPlotRange is based only on Options and AbsoluteOptions, so we cannot expect much from it. Charting`get3DPlotRange is more interesting: it is based on MathLink`CallFrontEnd[FrontEnd`AbsoluteOptions[FrontEnd`NotebookSelection[nbobj],Graphics3DBoxOptions]]. I have made an analog for Graphics but it does not work as expected. It is clear that FrontEnd`AbsoluteOptions just does not currently support Graphics. $\endgroup$ Commented Jan 12, 2014 at 10:26
  • $\begingroup$ @AlexeyPopkov Nice digging! $\endgroup$
    – Silvia
    Commented Jan 13, 2014 at 16:55
9
$\begingroup$

I've enhanced my GraphicsInformation function to return both the actual and the base PlotRange. Install with:

PacletInstall[
    "GraphicsInformation",
    "Site"->"http://raw.githubusercontent.com/carlwoll/GraphicsInformation/master"
];

and load with:

<<GraphicsInformation`

Then:

GraphicsInformation @ Graphics[{}, Frame -> True]

{"ImagePadding" -> {{23., 1.5}, {17., 0.5}}, "ImageSize" -> {360., 352.463}, "PlotRangeSize" -> {335.5, 334.963}, "ImagePaddingSize" -> {24.5, 17.5}, "PlotRange" -> {{-1.04167, 1.04167}, {-1.04, 1.04}}, "BasePlotRange" -> {{-1., 1.}, {-1., 1.}}}

Another example:

GraphicsInformation @ ContourPlot[Sin[x y], {x, 0, 7}, {y, 0, 2}]

{"ImagePadding" -> {{17., 1.5}, {17., 0.5}}, "ImageSize" -> {360., 359.}, "PlotRangeSize" -> {341.5, 341.5}, "ImagePaddingSize" -> {18.5, 17.5}, "PlotRange" -> {{-0.145833, 7.14583}, {-0.0416667, 2.04167}}, "BasePlotRange" -> {{0., 7.}, {0., 2.}}}

$\endgroup$
7
$\begingroup$

A completely stupid workaround that perhaps someone knows how to automate:

  • Create a Graphics object
    Graphics[{GeometricTransformation[Rectangle[], RotationTransform[1.]]}]
  • Right click the Graphics and select Get Coordinates
  • Drag around a bit in the graphics
  • AbsoluteOptions[< Put the object here >, PlotRange] gives the correct PlotRange

It also works by opening Drawing Tools and making a point (or anything else)

$\endgroup$
3
  • $\begingroup$ LOL Might be a nice clue :) $\endgroup$
    – Silvia
    Commented Jan 18, 2013 at 22:34
  • $\begingroup$ Perhaps you can make an outstanding answer out of this one. Check the packets JFultz mentioned on chat: StringCases[ Flatten@MathLinkCallFrontEnd[ FrontEndNeedCurrentFrontEndSymbolsPacket[]][[1, 1, 4]], ___ ~~ "Mouse" ~~ ___] $\endgroup$ Commented Nov 24, 2013 at 0:08
  • $\begingroup$ @belisarius Managed to crash my kernel a few times, but otherwise didn't get a reaction $\endgroup$
    – ssch
    Commented Nov 24, 2013 at 15:08
6
$\begingroup$

I filed a bug report with Wolfram about this issue, and they said

AbsoluteOptions seems to be returning the range for PlotRange -> Automatic. I have forwarded a report of the issue to our developers, using the information you provided.

$\endgroup$
1
  • $\begingroup$ Thanks for the report! Nice to know that! $\endgroup$
    – Silvia
    Commented Mar 10, 2017 at 10:35

Your Answer

By clicking “Post Your Answer”, you agree to our terms of service and acknowledge you have read our privacy policy.

Not the answer you're looking for? Browse other questions tagged or ask your own question.