14
$\begingroup$

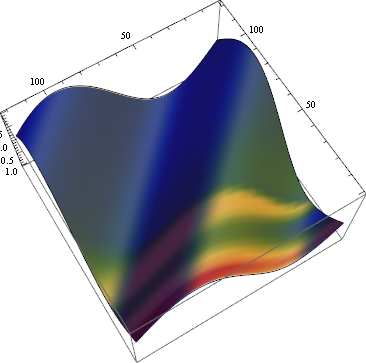
I have a 3 column list of data points. The first two columns correspond to x and y coordinates, with data points creating a surface in the z direction from column 3. This gives me a nice wavy surface.

I have a separate file of corresponding error values (chi) which amounts to a similar 3 columns: same x and y coordinates with chi values for each point in my data file. With this file, I've created a very nice (read: adequate) density plot, to show in 2 dimensions, via shading, the variation of chi across the parameter space.

What I'd LIKE to do, is then use this 2D representation to shade the 3D plot, sort of like a "hot" and "cold" graph so I can visualize where the errors tend to be highest and lowest, while easily associating them with my data.

Any ideas? Much appreciated!

Edit: Adding code and plots for clarity.

`ListDensityPlot[gchi[[All, {1, 2, 3}]],ColorFunction -> "DarkRainbow"]`
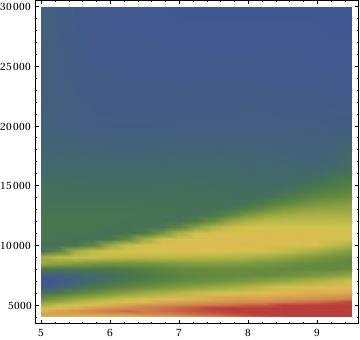
Density Plot - Chi Values

These are the colors I'd like plotted on the following 3D plot (of different values). The colors vary by value from blue(low) to red(high).

`ListPlot3D[{gband[[All, {1, 2, 3}]]}, PlotRange -> Full, Mesh -> 6,ColorFunction -> Function[{gchix, gchiy, gchiz}, Hue[gchiz]]]` 
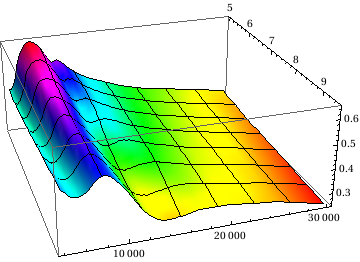
3D Parameter graph

This is the graph of "found" values for the functions I'm fitting. They're over the same space (x,y) coords as the density plot above, and here, the z components represent data points.

I'd like to color this 3D graph by a projection of the 2D density plot (of different values z, same values x,y) onto the rendered surface. Arbitrary color scheme, I just want it to vary by a separate function determined by a separate list of values.

$\endgroup$
7
  • $\begingroup$ Have you tried using a different ColorFunction on 'ListPlot3D`? $\endgroup$
    – Eli Lansey
    Commented Oct 26, 2012 at 2:36
  • $\begingroup$ I've used a few built in ColorFunction's on my ListPlot3D. The trouble is, I don't just want a pretty colored graph, based (perhaps) on the x,y, or z values of that graph; I want it colored by a different function entirely, effectively a 4th coordinate represented. $\endgroup$ Commented Oct 26, 2012 at 2:42
  • $\begingroup$ Perhaps I should clarify and ask how to create a new color function in x and y, based on the values of z, then use this ColorFunction to color a separate ListPlot3D. $\endgroup$ Commented Oct 26, 2012 at 2:44
  • $\begingroup$ I'm pretty sure there's an example of exactly that in the help file. $\endgroup$
    – Eli Lansey
    Commented Oct 26, 2012 at 2:50
  • 1
    $\begingroup$ You might find Heike's answer to a similar question useful. $\endgroup$
    – kglr
    Commented Oct 26, 2012 at 6:30

2 Answers 2

11
$\begingroup$

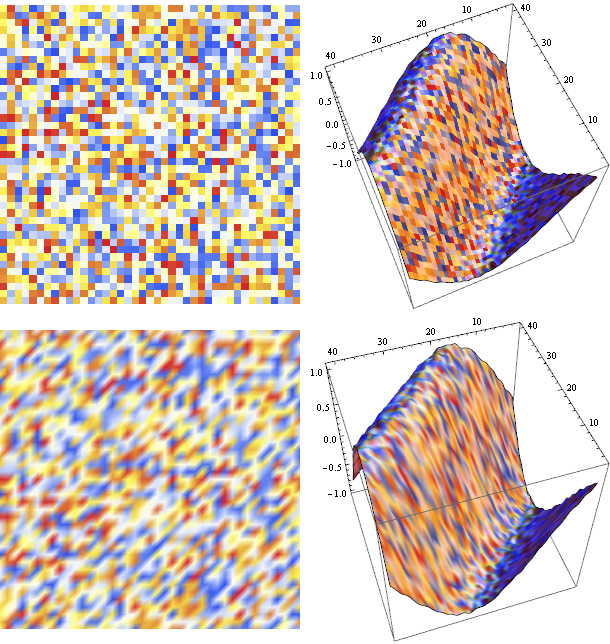
As an alternative to using ColorFunction, one can also use PlotStyle ->Texture[img] where img can be a 2D graphics using some features of the input data.

Few examples using data with a similar structure to the one described in OP's question:

 datatable =Table[{Sin[j + i] + .05 RandomReal[], RandomReal[]}, 
    {i, -2, 2, 0.1}, {j, -2, 2, 0.1}]; 

 options =  Sequence[ColorFunction -> "TemperatureMap", Frame -> False, 
   PlotRangePadding -> None, ImagePadding -> None, ImageSize -> 300, Mesh -> None];
 texture1 = ArrayPlot[datatable[[All, All, 2]], options];
 texture2 = ListDensityPlot[datatable[[All, All, 2]], options];
 lstplt1 = ListPlot3D[datatable[[All, All, 1]], BoxRatios -> 1, Mesh -> None,
    TextureCoordinateFunction -> ({#1, #2} &), 
    TextureCoordinateScaling -> True, PlotStyle -> Texture[texture1]  ];
 lstplt2 = ListPlot3D[datatable[[All, All, 1]], BoxRatios -> 1, Mesh -> None,
    TextureCoordinateFunction -> ({#1, #2} &), 
    TextureCoordinateScaling -> True, PlotStyle -> Texture[texture2]];
 Grid[{{texture1, lstplt1}, {texture2, lstplt2}}]

enter image description here

Another example using the cropped version of the 2D image in OP's question:

 ListPlot3D[Table[Sin[j + i], {i, -3, 3, 0.05}, {j, -3, 3, 0.05}], 
  TextureCoordinateFunction -> ({#1, #2} &), PlotStyle -> Texture[img],
  PlotRange -> All, BoxRatios -> {1, 1, 1/2}, 
  Mesh -> None, ImagePadding -> None]

enter image description here

$\endgroup$
2
  • $\begingroup$ Thanks for the response. I really appreciate it! I learned plenty from your code--aside from your specific response. I think I'll use the other method, as it seems more in the way I'd originally wanted to solve the problem. $\endgroup$ Commented Oct 26, 2012 at 7:14
  • $\begingroup$ @Ben, my pleasure. Welcome to mma.se. $\endgroup$
    – kglr
    Commented Oct 26, 2012 at 7:23
11
$\begingroup$

DensityPlot just colorizes your array by choosing colors for scalar values and plot the array like an image. The ColorFunction option of ListPlot3D or Plot3D does basically the same with the difference, that it uses the height values of the function you plot as indicator for the color.

What you want is close: You want to use the height-values of another array as indicator for the color. Therefore, one approach would be to interpolate your first array to make a function from it and then use it inside the ColorFunction of your ListPlot3D:

densFunc = 
  ListInterpolation[
   Table[Sin[x y]^2, {y, 0, Pi, 0.1}, {x, 0, Pi, 0.1}], {{0, 1}, {0, 1}}];

The inside Table is the equivalent of your gchi array. Now you can set up the ListPlot3D (I use Plot3D here, so spare the creating of a second array)

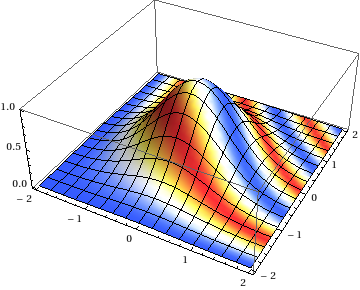
Plot3D[Exp[-(x^2 + y^2)], {x, -2, 2}, {y, -2, 2}, 
 ColorFunction -> 
  Function[{x, y}, ColorData["TemperatureMap", densFunc[x, y]]], 
 PlotPoints -> 50]

Mathematica graphics

Additional notes

  • when your gchi data is not on a regular grid, then you cannot simply use ListInterpolation.
  • Note, that you directly use densFunc inside ColorData which does expect values between [0,1]. So if the z-values of your array you want to use for colorization is not normalize, you should take care of this.
  • Be aware that per default parameters to ColorFunction (x,y,z) are normalized to [0,1]. That's why my above example works although my interpolation function is only defined in the unit-square and I use Plot3D in larger region. Look at the option ColorFunctionScaling.
$\endgroup$
1
  • $\begingroup$ Thanks! I had the feeling I was close, but just learning the ins and out of Mathematica. The two answers I've received have both been extremely helpful, but this one is more in the vein of what I'd like to do. $\endgroup$ Commented Oct 26, 2012 at 7:13

Your Answer

By clicking “Post Your Answer”, you agree to our terms of service and acknowledge you have read our privacy policy.

Not the answer you're looking for? Browse other questions tagged or ask your own question.