24
$\begingroup$

How do I vertically align plots so that the two plots are displayed in a way that lines up with respect to the axes?

The code I have so far is:

GraphicsColumn[
 {
  Plot[0.125 x^2 + 0.05 x^3 + 0.005 x^4, {x, -8.0, 3.0}, 
    AspectRatio -> .4, PlotRange -> {-.19, .7}, Frame -> True,
    FrameStyle -> Thickness[.003],
    FrameLabel -> {Null, "V(x)", "m=1.0,   w=0.5,   y=2.0,   g=1.0"}, 
    FrameTicks -> {{Automatic, Automatic}, {None, All}}], 
  Plot[0.5 + 0.2 x, {x, -8.0, 3.0}, AspectRatio -> .4, 
    PlotRange -> {-1, .9}, Frame -> True,  FrameStyle -> Thickness[.003], 
    FrameLabel -> {"x", "B(x)", Null}, 
    FrameTicks -> {{Automatic, Automatic}, {Automatic, Automatic}}]
 }, 
 ImageSize -> 500, Frame -> None, Spacings -> -20]

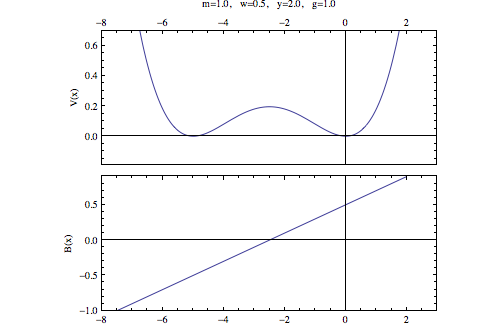
My horrid attempt to align plots

I'm looking at this right now, and realized how ugly this is... like why is the lower frame thicker than the upper one???

$\endgroup$
5
  • $\begingroup$ Use AbsoluteThickness instead of just Thickness $\endgroup$
    – rm -rf
    Commented Oct 20, 2012 at 23:21
  • $\begingroup$ @rm-rf oh! thanks! $\endgroup$
    – QuantumDot
    Commented Oct 20, 2012 at 23:22
  • 1
    $\begingroup$ IMHO, this is one of the few things that is easier to do in MATLAB (using the subplot function) than in Mathematica. But make no mistake, I prefer Mathematica 1000 times over MATLAB. $\endgroup$ Commented Dec 13, 2012 at 14:49
  • $\begingroup$ The (new?) option PlotLayout -> "Column" for ListPlot takes care of this alignment. Unfortunately it is not available for Plot (only ListPlot). $\endgroup$ Commented Jul 1, 2019 at 15:19
  • 1
    $\begingroup$ There is a new PlotGrid Resource Function for this: resources.wolframcloud.com/FunctionRepository/resources/… $\endgroup$ Commented Oct 23, 2019 at 13:23

1 Answer 1

22
$\begingroup$

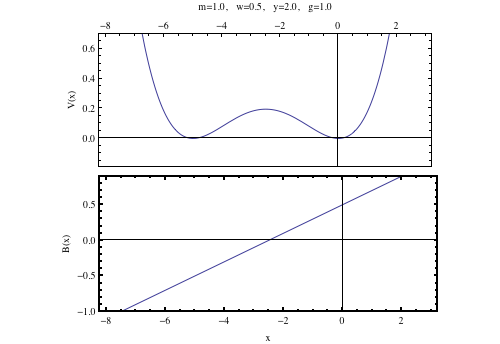
Firstly, you need to use AbsoluteThickness instead of Thickness, as the latter is relative and is a fraction of the horizontal plot range. Secondly, for precise alignment, you'll have to give both figures the exact same ImagePadding (just like you did with other options), as otherwise, each plot chooses its own padding depending on the extents of the ticks, labels, etc.

Here's how it will look if you fix these (working code given at the end):
A natural question that arises, is "How do you choose the right ImagePadding?" Surely, you can't be fiddling with the values all day... The solution is to use this idea to create a function that gets the max padding for both plots, like:

getMaxPadding[p_List] := Map[Max, (BorderDimensions@
    Image[Show[#, LabelStyle -> White, Background -> White]] & /@ p) ~Flatten~ {{3}, {2}}, {2}] + 1

I used this function in this answer to align two plots vertically. I'll leave incorporating this into your code as an exercise (not very hard, since my answer shows you how to use it).

The code for the figure above is:

GraphicsColumn[{
  Plot[0.125 x^2 + 0.05 x^3 + 0.005 x^4, {x, -8.0, 3.0},
   AspectRatio -> .4,
   PlotRange -> {{-8, 3}, {-.19, .7}},
   Frame -> True,
   FrameStyle -> AbsoluteThickness[.003], 
   FrameLabel -> {Null, "V(x)", "m=1.0,   w=0.5,   y=2.0,   g=1.0"}, 
   FrameTicks -> {{Automatic, Automatic}, {None, All}},
   PlotRangePadding -> None,
   ImagePadding -> {{40, 1}, {20, 30}}],

  Plot[0.5 + 0.2 x, {x, -8.0, 3.0},
   AspectRatio -> .4,
   PlotRange -> {{-8, 3}, {-1, .9}},
   Frame -> True, FrameStyle -> AbsoluteThickness[.003],
   FrameLabel -> {"x", "B(x)", Null}, 
   FrameTicks -> {{Automatic, Automatic}, {Automatic, Automatic}},
   PlotRangePadding -> None,
   ImagePadding -> {{40, 1}, {20, 30}}]
  }, ImageSize -> 500, Spacings -> -30]
$\endgroup$
3
  • $\begingroup$ Even with the update the x-axis label on the bottom image is missing. I have gotten better looking results with your code by setting ImagePadding -> {{40, 1}, {30, 30}} for plots and Spacings -> -40 for the graphics column. Also, isn't FrameTicks -> {{Automatic, Automatic},{Automatic, Automatic}} really just the same as FrameTicks -> Automatic. Actually, I'd use FrameTicks -> {{Automatic, Automatic}, {All, None}} for the lower plot. $\endgroup$
    – m_goldberg
    Commented Oct 22, 2012 at 7:54
  • 1
    $\begingroup$ @m_goldberg Yes, I was sloppy in setting the image padding, but as I indicated earlier, it was just an example and the OP has to tweak it to get the right values for his needs. I also gave hints (see getMaxPadding in the middle) on how to automatically get the maximum padding of both plots and apply it to the figure. Lastly, yes, that is the same as FrameTicks -> Automatic, but this isn't my code... this is the OP's code, with minor modifications to solve the issue at hand. I didn't bother looking at other stuff. $\endgroup$
    – rm -rf
    Commented Oct 22, 2012 at 13:00
  • $\begingroup$ The Image command inside getMaxPadding kept failing for me. I replaced it with Rasterize and now it works well. $\endgroup$ Commented Jul 1, 2019 at 16:00

Your Answer

By clicking “Post Your Answer”, you agree to our terms of service and acknowledge you have read our privacy policy.

Not the answer you're looking for? Browse other questions tagged or ask your own question.