Could anyone provide a function that takes a polygon as input and outputs its visibility graph ? Visibility Graph
If not, is there a function that checks whether a line segment lies inside a polygon?
Could anyone provide a function that takes a polygon as input and outputs its visibility graph ? Visibility Graph
If not, is there a function that checks whether a line segment lies inside a polygon?
The RegionDifference and RegionMeasure functions can be parlayed into a function that looks at whether a given line segment lies inside a given region of a plane. Basically, you use RegionDifference to find a representation of the part of each line segment that lies outside the polygon, and then use RegionMeasure to calculate its length. If the result is zero, then the line lies inside the polygon, and so we have an edge in the visibility graph. Here's an example:
pts = {{0.662494051836106`,  0.39007247052752403`}, {0.1837087927842842`,  0.38632927614895274`}, {0.7310240254669638`, 0.8628672998019931`}, {0.8896898456472895`, 0.6441236848987553`}, {0.7560380846919499`, 0.13152467108636823`}, {0.2554583695590438`, 0.16840295208595313`}}
Graphics[{Red, Polygon[pts], Black, Table[Text[i, pts[[i]]], {i, 1, Length[pts]}]}]
lines = Outer[Line[{#1, #2}] &, pts, pts, 1];
adjmat = Map[ Boole[RegionMeasure[RegionDifference[#, Polygon[pts]]] == 0] &, lines, {2}] - IdentityMatrix[Length[pts]];
AdjacencyGraph[adjmat, VertexLabels -> "Index"]
A few notes on this construction:
lines contains all the lines connecting all pairs of points in the polygon, in an $n \times n$ matrix. ($n$ is the number of points of the polygon.)
adjmat is constructed by testing whether the amount of each element of line lying outside the polygon is zero or non-zero. The equality test yields True or False, which is then converted to 1 or 0 respectively by Boole. We then subtract the identity matrix to specify that we are not viewing each vertex as visible to itself (though if you are, then you should eliminate the last piece of this line.
This code takes about 30 seconds to run on my machine (a two-year-old iMac), so it's not particularly quick; it could probably be optimized quite a bit.
EDIT: if you want the resulting graph to have the points laid out as they are in the polygon, you can either use GraphPlot with the VertexCoordinateRules option (as described by @HarshaTirumala in the comments), or use the VertexCoordinates option for AdjacencyGraph:
AdjacencyGraph[adjmat, VertexLabels -> "Index", VertexCoordinates -> pts, VertexSize -> Tiny]
AdjacencyGraph[adjmat, VertexLabels -> "Index", VertexCoordinateRules -> pts] you'll get a graph with the points laid out at their "true" locations. Alternately, you could use Select to pick out the interior lines out of lines and use Graphics to render them. If I have time tomorrow, I'll update this answer.
$\endgroup$
Commented
May 27, 2016 at 1:37
GraphPlot[adjmat, VertexCoordinateRules -> pts] . Thanks for your effort.
$\endgroup$
Commented
May 27, 2016 at 4:42
GraphPlot accepted adjacency matrices to construct graphs, so thanks for the tip! Now that I have a copy of MM to play with, I found a way to do it with AdjacencyGraph as well; see my edited answer.
$\endgroup$
Commented
May 27, 2016 at 13:47
adjmat = Map[Boole[Region`RegionSubset[#, Polygon[pts]]] &, lines, {2}] - IdentityMatrix[Length[pts]];
$\endgroup$
This code is not as pretty as Michael Seifert's, but I think it runs a bit faster.
Essentially, when looking at any two vertices, we first decide whether the line connecting them is part of the polygon boundary. If so, that is an edge to the graph. If not, we look at the length of the line that is inside the polygon, and if it is equal to the total length of the line, that is an edge to the graph. Here is the function
visibilityGraph[pts_List, opts : OptionsPattern[]] :=
  Module[{lines, vis},
   lines = Sort /@ Transpose[{pts, RotateRight@pts}];
   vis[a_, b_] :=
    If[MemberQ[lines, Sort[pts[[{a, b}]]]],
     True,
     RegionMeasure[
       RegionIntersection[Line[pts[[{a, b}]]], Polygon@pts]] ==
      ArcLength[Line[pts[[{a, b}]]]]
     ];
   Graph[Range@Length@pts,
    #1 <-> #2 & @@@
     Select[
      Subsets[Range@Length@pts, {2}],
      vis @@ # &], opts]
   ];
visibilityGraph[poly_Polygon, opts : OptionsPattern[]] :=
 visibilityGraph[First@poly, opts]
Here it is applied to the polygon from the answer above,
visibilityGraph[pts, VertexLabels -> "Name"] // AbsoluteTiming

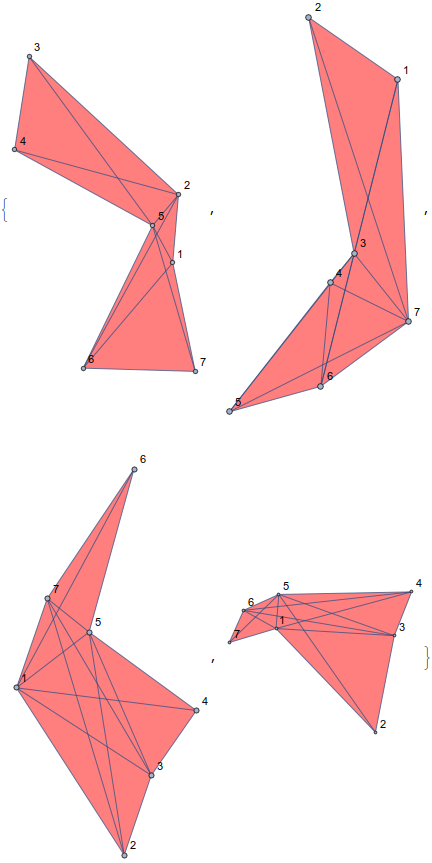
And here it is applied to a set of random concave polygons (and here I'm putting the polygon in the background and using the points as the vertex coordinates for the graph)
pgons = Get[
   "https://gist.githubusercontent.com/jasondbiggs/\
59cb7d4aa802bde68c9f6a5203ef698f/raw/\
8b3768422fdcc5c28d03cd1d7a5361c0a1d2d15a/gistfile1.txt"];

Show[Graphics[{Red, Opacity[0.5], #}],
   visibilityGraph[#, VertexLabels -> "Name",
    VertexCoordinates -> First@#], ImageSize -> 200
   ] & /@ pgons

RegionIntersection and RegionMeasure need a lot more computational power to figure out that a line passes along the edge of a given region that they do to figure out that a line passes through the interior; so avoiding the calls to these functions in the case of the exterior edges of the polygon should save a lot of time.
$\endgroup$
Commented
May 27, 2016 at 13:36
If not, is there a function that checks whether a line segment lies inside a polygon?
WolframLanguageData["RegionWithin", {"VersionIntroduced",
  "DateIntroduced"}]
Using data from Michael Seifert's answer:
pts = {{0.662494051836106`,
   0.39007247052752403`}, {0.1837087927842842`,
   0.38632927614895274`}, {0.7310240254669638`,
   0.8628672998019931`}, {0.8896898456472895`,
   0.6441236848987553`}, {0.7560380846919499`,
   0.13152467108636823`}, {0.2554583695590438`, 0.16840295208595313`}}

poly = Polygon@pts;
x = Subsets[Range[Length@pts], {2}];
t = Line /@ (Part[pts, #] & /@ x);
sel = Pick[t, RegionWithin[poly, #] & /@ t];

Graphics[{
  Opacity[0.6, Yellow], Polygon@pts
  , Brown, t
  , Blue, Thick, sel
  }]